eventstudy.Multiple.plot
-
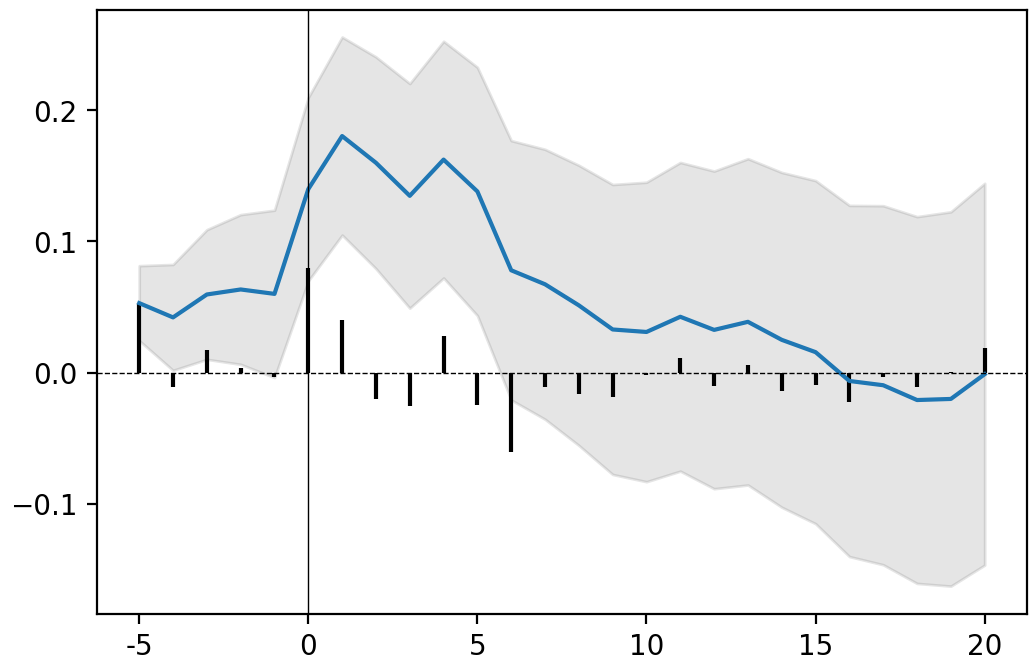
Multiple.plot(*, AAR=False, CI=True, confidence=0.9)¶ Plot the event study result.
- Parameters
AAR (bool, optional) – Add to the figure a bar plot of AAR, by default False
CI (bool, optional) – Display the confidence interval, by default True
confidence (float, optional) – Set the confidence level, by default 0.90
- Returns
Plot of CAAR and AAR (if specified).
- Return type
matplotlib.figure
Note
The function return a fully working matplotlib function. You can extend the figure and apply new set-up with matplolib’s method (e.g. savefig).
Example
Plot CAR (in blue) and AR (in black), with a confidence interval of 95% (in grey).
>>> events = es.Multiple.from_csv(
...     'AAPL_10K.csv',
...     es.Single.FamaFrench_3factor,
...     event_window = (-5,+5),
...     date_format = '%d/%m/%Y'
... )
>>> events.plot(AR = True, confidence = .95)